Showing posts with label Banks. Show all posts

Wednesday, February 22, 2012

Middle Banks - Bic Banco versus Daycoval

Below is a comparison table between this 2 banks. I wish to draw attention to:
  • Financial operations expenses increased a lot, specially in Bic Banco, due to increase in provisions for loan losses (+98%)
  • Loan Portfolio of Daycoval has been increasing a great deal: 42% in 2011 and more than doubled since the end of 2009.
  • Daycoval seems to have a more diversified portfolio service: exchanges bureaus, Daypag and Asset Management (1.4 billion under management)
  • Daycoval also looks more profitable: better NIM, ROE, efficiency ratio...

Thursday, February 16, 2012

Banco do Brasil adjusted net income: believe it or not!

In the release of its results for 2011, Banco do Brasil publishes the recurring net income, that is the net income adjusted by one-off items, such as Additional Allowance for Loan Losses, Contingent Liabilities, Reversal of Labor Liabilities...

So far so good. But as they say, the devil is in the details. In this case, it's in the notes to the financial statements: adjustments of actuarial assets/liabilities.

So if we exclude this "earnings" under Other Operating Income, real adjusted net income would be:

BRL Millions 2010 2011 Avrg
Account Net Income          11.703    12.126    11.915
(-) One-Off Items            1.039          375          707
Recurring Net Income Published          10.664    11.751    11.208
(-) Adjustment of actuarial assets/liabilities            4.299      2.981      3.640
Real Recurring Net Income            6.365      8.770      7.568


Wednesday, February 15, 2012

Largest Banks x Banrisul

I put Banrisul (BRSR6) at the side of the largest banks and the comparison is just amazing!

(click to enlarge)

Tuesday, February 14, 2012

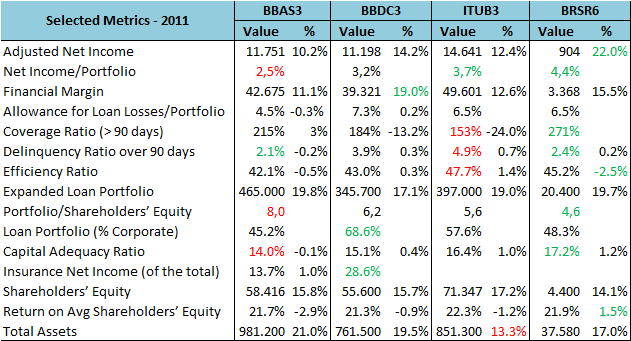
Banco do Brasil, Bradesco and Itau - 2011 Results Compared

I'll show a bunch of selected metrics of the largest brazilian banks in order to take a more clear picture of 2011 results. My comments are as follow:

Banco do Brasil (BBAS) 
  • Has the lowest ratio Net Income/Portfolio, so to have the similar ROE as the other 2 has to be more leveraged (lowest Capital Adequacy Ratio).
  • On the other hand, BBAS has the lowest Delinquency Ratio over 90 days: 2.1%

Sunday, November 27, 2011

Which bank is better - Part 3

Now I decided to take a closer look to the financial statements of the three major banks (click to enlarge):

As I had commented, BBAS3 charges proportionally less for loan losses than BBDC3 and ITUB3 does. Also, note that BBAS3 is paying more taxes than the other two.

Tuesday, November 22, 2011

Which bank is better - Part 2

I just forgot to take into account allowance for loan losses. Also included Banrisul figures.
Now BBAS becomes even worse: with more risk it's one that have the least allowance for loan losses!
Or put in other way, BBAS only can get ROE over 20% because its high leverage level and, probably, charges insufficient allowance for losses.


Which bank is better?

I remember I've read that the best way to analyse banks profitability is to look at Return over Assets. In so doing you're able to calculate return without considering leverage level (risk).

In the table bellow it's clear that, although all banks have similar returns over equity, ITUB is the most profitable with less risk (leverage/BIS ratio). BBAS on the other hand, can reach similar ROE to private banks just if it leverage too much.


Tuesday, August 9, 2011

Large Banks Compared


They are very similar, here goes some notes:
  • BBAS3 had stock issuance, so earnings growth per share is less than 40.0%
  • BBAS3 has less allowance for loan losses, but it has the minor delinquency ratio and more coverage ratio, so I think it's OK.
  • BBAS3 has the best efficiency ratio, while ITUB3 has the worst. What a surprise!
  • BBDC3 has more than 2/3 of its loan portfolio destined to corporate and almost 30% of its earnings comes from insurance. That's good!
  • Be surprised again: ITUB3 has the worst ROE, while BBAS3 has the best one.
  • Considering  Loan Portfolio/Shareholders’ Equity, we can say that BBAS3 is most leveraged, while ITUB3 is the less one. That could explain the profitability difference.

Tuesday, August 2, 2011

Itau versus Bradesco

I'll also post BBAS figures when available for 2Q11.
I think that BBDC is getting better than ITUB.


Thursday, July 28, 2011

BBAS3 - Banco do Brasil

I took all results available in Fundamentus for BBAS3. It's exactly 8 years of data.
Then I calculated quarterly return (ROE) and after that I excluded the best 8 quarters.
For the remaining 6 years of worst returns I get an average ROE of 23%.
That applied to the current net equity would generate BRL 12 billions.
So BBAS3 can be bought for just 6 times its average earnings.
Also, Banco do Brasil has been distributing average dividends since 2008 of BRL 3.5 billions per year, wich gives a yield of 6.7% (I discounted 15% of all values, because de series doesn't shows what is dividend and what is JCP).
In short: Fundamentus data for BBAS3 are not distorted in relation to historical mean.

Wednesday, July 27, 2011

ITUB3 - Itau


From Itau site I got the following numbers:

Avrg ROE last 10 Years: 28.5%
Avrg ROE last 3 Years: 23.0%

Let's be conservative and consider that Itau can maintain 20% profitability from here now on. As net equity amounts now for BRL 63.7 billions, earnings can be expected to be around 12.7 (last year was 13.3).

So, at current market value P/E is less than 10!
Would you bother to take a share in this excelent asset?

Using the same reasoning, BBDC3 would be trading now for 8.8 its earnings.
It's a matter of taste!

And BBAS3 for less than 7.0 (and I'm using ROE of 20%, although avrg ROE is over 25% since 2005).

Thursday, June 23, 2011

BICB4 - Bicbanco

I've made a simple analysis in BICB4 figures:

  • Margin from financial operations income dropped (up only 36% when portfolio soared 45%);
  • Financial operations expenses for deposits, money market, borrowings and others grew 53%. What worries me is that allowance for loan losses grew only 7%, even with a stunning increase in loan portfolio;
  • This resulted in an increase of gross profit from financial operations of just 20%;
  • On the other hand, personnel expenses, administrative expenses an others grew only 7% (1);
  • Finally, operating result increased 33%.
- Dividend yield (3 years): 6.0%
- Mean P/E last 3 years: 8.0

Has the time come to start a buying?

(1) BICB had extraordinary income in 2009 related to PIS Law 2.445 e 2.449/88 and  Amnesty Law 11.941/09 of about 90 million. I'm expurgating that from 2009 operating results.

Tuesday, May 10, 2011

BBAS3 - Banco do Brasil

Main numbers (1Q11 x 1Q10) that hold my attention at a glance:

Loan Portfolio: 21% (almost 20% of market share)
Income (recurrent): 2.9 bi, growth of 42%
Default Rate: 2.1% (versus 3.2% market)
Payout: should be maintained at 40%


Monday, April 25, 2011

Medium Banks

Planner recomenda distância de bancos médios

Papel P/L P/VP ROE Patrim. Líq
BBAS3 7,06 1,64 23,29% 50.495.700.000,00
BICB4 8,17 1,46 17,82% 1.954.650.000,00
SFSA4 8,24 0,81 9,86% 770.870.000,00
ABCB4 9,09 1,36 15,00% 1.347.920.000,00
PRBC4 9,2 1,31 14,19% 827.660.000,00

Thursday, March 10, 2011

And how much would I pay for BBAS3

I took the last 3 years (12 quarters) of BBAS3 and I abandoned  the 2 best ones, because them are clearly diverging from the mean (over BRL 4 billion each one, probably because of CIEL3 and actuarial pension plan tricks). The annual mean for the remaining 10 quarters gives a net earnings of BRL 9 billion.


So I considered 50% of this amount as being cash generated, growthing at 5% for the next 10 years and 3% from there on. I discounted at a rate of 10.1% (real rate, considering SELIC 1% per month).
The target price resulting are 29.10, with a P/E slightly above 9. 


Taking into account that I like to be (too) conservative with the parameters (earnings, growth and discount rate) I only demand about 20% or less of safety margin, so I'll start to buy when (and if) the share comes around 25,00.

Wednesday, March 2, 2011

The most important thing about Banrisul


What I think is the most important upside of Banrisul (BRSR6) is it's low funding cost. Other major feature is the Banricompras, wich financial volumes have been growing between 20 and 25% a year.


Thursday, February 24, 2011

Is SANB11 cheap?

baIs there an oportunity in Santander (SANB11)?

P/book value: 1,16
Book value: 64.877.000.000 BRL
ROE: 5,9%

Would't be reasonable that Santander's ROE will at least get close to it's peers ROE?

Considering that SANB's ROE gets to 15% in 10 years from now, wich would result in a P/E of 7,67, would it be a good investment?

Well, it must be taken in consideration that BBAS3 current P/E today is 7,15 ... so why take the chances with Santander?

Tuesday, February 22, 2011

How much would I pay for BBAS3

At wich price would BBAS be a safe investment?

First, I must enphasize that my margin of safety is 50% and my discount rate is 7% (I increased 0,5% because of the political influence in the management).

That said, it's important to choose the initial earnings to start with. I used the last 3 years average, wich is around 10,000 millions (in R$).

The payout is 40%.

The initial growth will be 8% a year (that's the double of what seems to be the speed limit for the brazilian economy at the present rate of savings/GDP. I doubled it because it's expected that the financial sector will increase it's share of GDP, and there's plenty of space for it), for 10 years.

After 10 years the growth will be 2%, because it's the average growth rate of brazilian economy during the bad times of the 80's and the 90's, before the current period of bonanza.

The results: 10,000 millions x 40%, growing 8% for 10 years and 2% thereafter, divided for 2 (margin of safety) equals to .... 65,834 millions, wich dividend by 2.860.729.247 shares equals to R$ 23,01.

BBAS3 closed yesterday at R$ 29,35.

Wednesday, February 9, 2011

Average ROE for Banks in the past 5 years

Metrics BBAS3 BBDC3 ITUB3
Avrg ROE last 20Q 23,4% 23,7% 25,1%
Avrg ROE worst last 16Q 19,4% 20,5% 22,6%
Expected earnings 9.366 9.460 12.910
Avrg P/E          8,80          9,62        10,22